This article was originally published on Brink on September 13, 2018
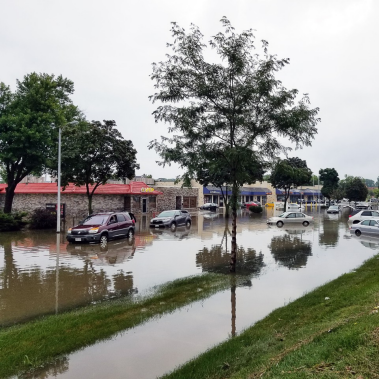
Disaster insurance can be a critical part of household and community resilience. Government disaster aid is rarely enough to cover the costs of the repairs and rebuilding that must be done. After Hurricane Harvey, for example, the average household grant from the Federal Emergency Management Agency (FEMA) was only $4,300, while the average flood insurance claim payment was $115,000. This may explain why households with insurance are more likely to rebuild.
And yet, every flood demonstrates again and again that most people at risk are not insured: Over three-quarters of buildings flooded by Hurricanes Sandy, Irma, and Harvey were uninsured.
It has been often-repeated as a truism that people don’t buy flood insurance unless they are forced to do so. Indeed, low voluntary purchase of flood insurance prompted Congress to create a mandatory purchase requirement back in 1973. Purchase of flood insurance is mandatory for homeowners in a mapped 100-year flood plain with a loan from a federally backed or regulated lender. Flood-plain boundaries are drawn on FEMA maps; the 100-year flood plain, or area of 1 percent annual chance flooding, is referred to as the SFHA, or Special Flood Hazard Area.
Residential flood insurance has been offered for the last fifty years through the federal National Flood Insurance Program (NFIP), housed in FEMA. A small private market is now emerging, but it is currently less than 5 percent of all residential flood policies purchased nationwide.
While take-up rates in many parts of the country remain low for flood insurance, there are places where many households are insured and, surprisingly, places where most flood insurance is purchased outside of the FEMA-mapped high-risk areas. We offer three findings about residential NFIP purchases as demonstrated in three maps. All the data is from February, 2018.
Figure 1. Residential flood insurance is concentrated in a few areas, largely along the Gulf and East coast
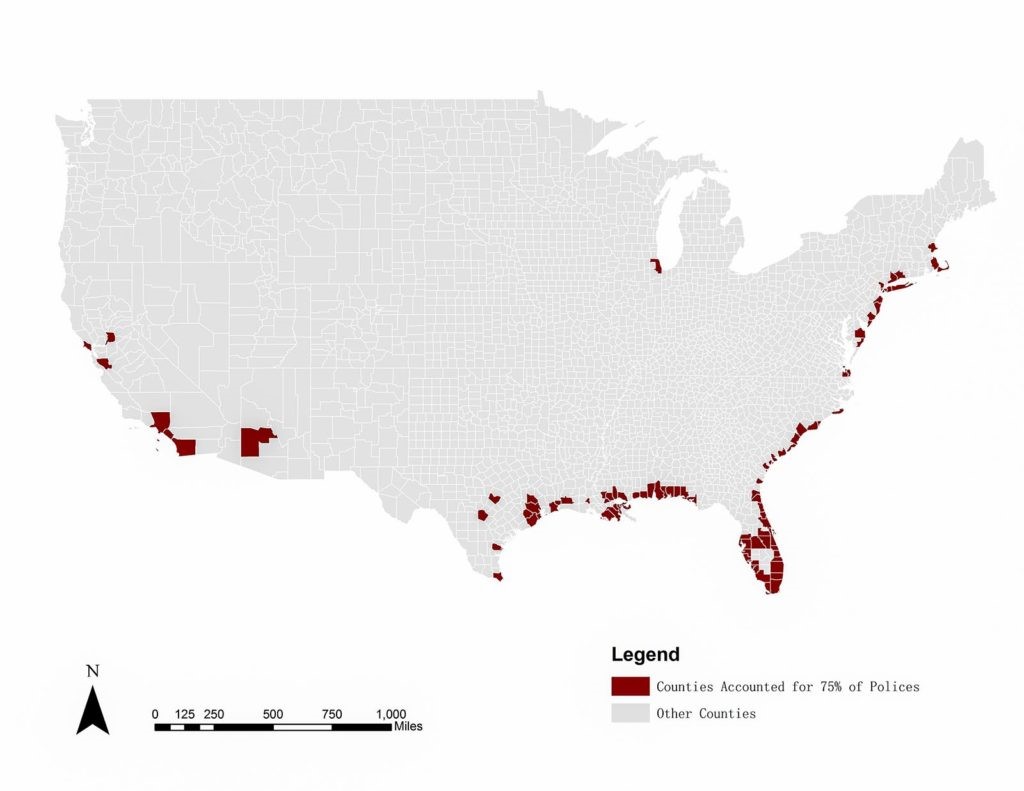
NFIP residential policies are heavily concentrated in coastal counties, especially those along the Gulf and Atlantic coasts of the U.S. As shown on the map, 99 counties—just over 3 percent of all U.S. counties—account for 75 percent of all residential NFIP policies. Roughly 80 percent of U.S. counties have fewer than 500 residential NFIP policies. Along the coast, however, there are counties with tens of thousands of residential policies. Harris County, Texas; five counties in Florida (Miami-Dade, Broward, Palm Beach, Lee, and Pinellas); and Jefferson Parish, Louisiana, all have more than 100,000 residential flood policies.
While the NFIP is largely a coastal program, flooding occurs around the country. In the last decade, every single state has experienced a damaging flood. Furthermore, as climate change increases the frequency of heavy precipitation events, the risk of stormwater flooding—usually not shown on FEMA maps and not communicated to residents—is increasing. Often occurring outside of mapped 100-year flood plains, this leaves many households financially vulnerable.
Figure 2. Take-up rates for flood insurance among residential properties is generally low, with a few exceptions usually in coastal areas.
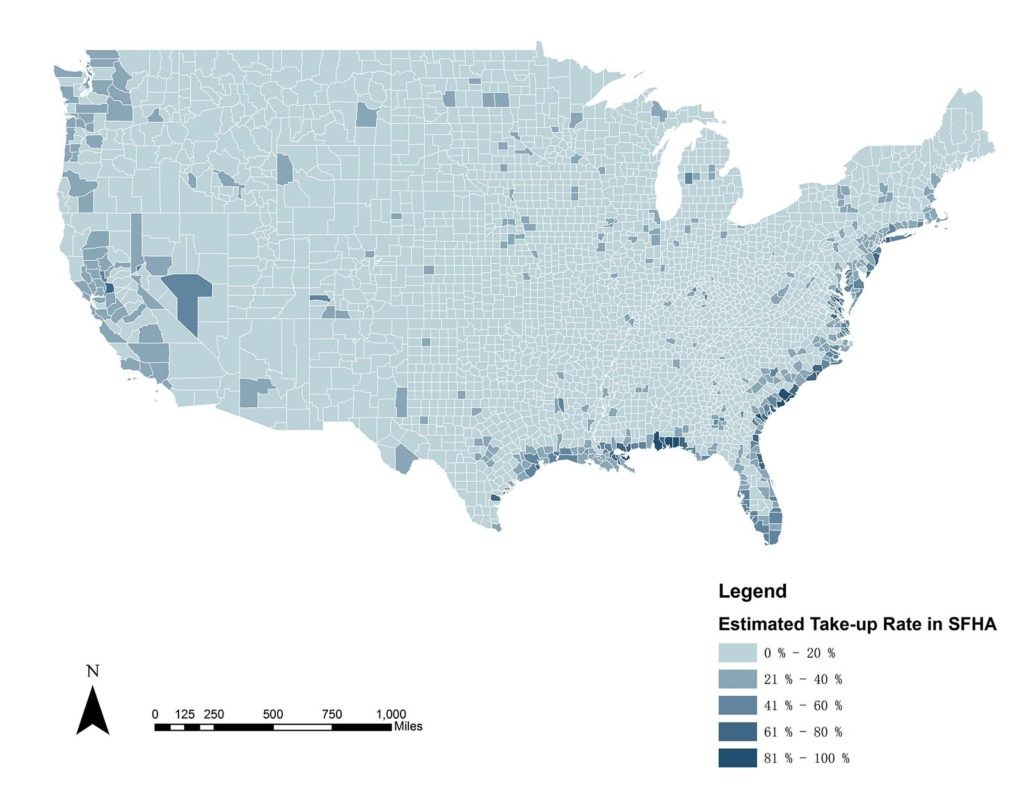
In some counties, absolute numbers of policies are high simply because there are more homes at risk of flooding. When looking instead at take-up rates, or estimates of the percentage of residences insured in SFHAs, similar patterns of generally low market penetration but higher take-up along the coasts are evident.
Over three-quarters of buildings flooded by Hurricanes Sandy, Irma, and Harvey were uninsured
In a handful of counties, take-up in the SFHA is over 80 percent. These tend to be coastal areas such as St. Bernard Parish, Louisiana, and Okaloosa County, Florida. A few inland areas with high flood risk, such as Sacramento County, California, have residential take-up rates in the SFHA over 60 percent.
On average around the country, however, the take-up rate in the SFHA averages around 30 percent. This points to the ongoing flood insurance gap, even in high-risk areas.
Figure 3. In a few counties around the country, the majority of residential flood insurance is purchased by homeowners outside the highest-risk areas.
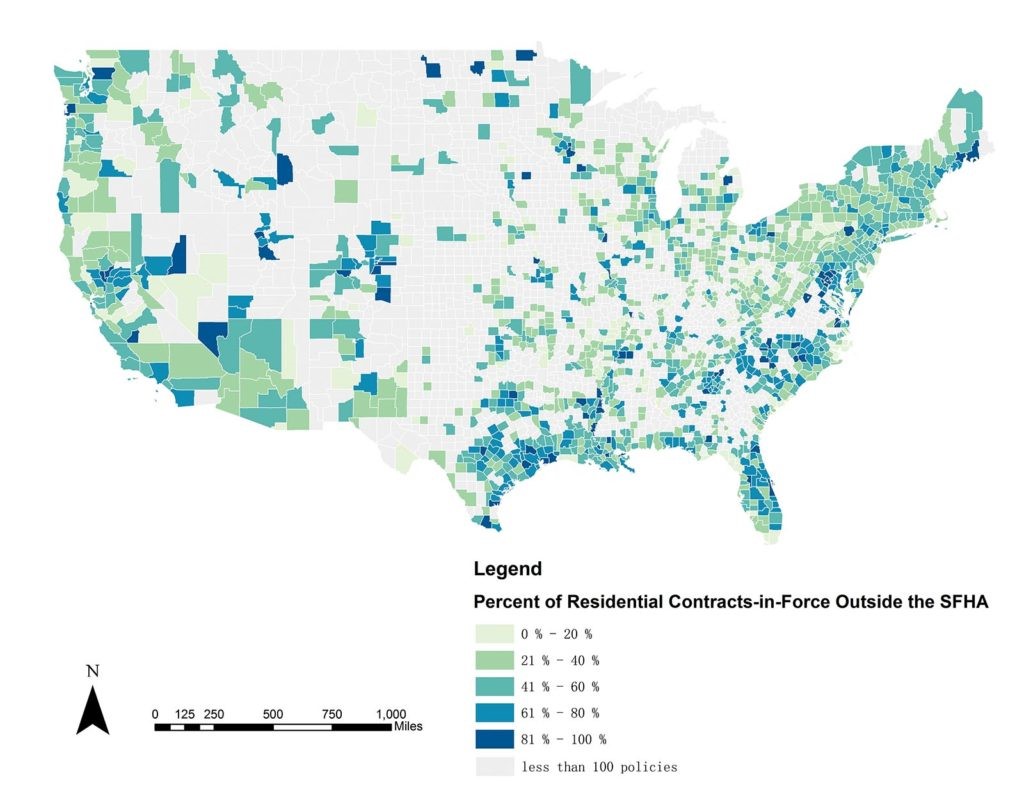
While low take-up rates suggest many people do not voluntarily purchase flood insurance, there are some places around the country where the majority of residential flood contracts in force* are outside the SFHA. This is surprising, as outside the SFHA, there is no mandatory purchase requirement and no disclosure of flood risk. Many of the policies outside the SFHA are lower-cost Preferred Risk Policies (PRP), available to properties outside high-risk areas with a favorable loss history.
Across the state of Texas as a whole, for example, close to three-quarters of all residential NFIP contracts are outside the SFHA. This does not mean take-up rates are high, but of the policies purchased, many are outside the FEMA-mapped high-risk areas. So, while only roughly 15 percent of homes in Harris County, Texas, had flood insurance when Harvey struck, over 70 percent of those were outside the mapped 100-year flood plain.
There may be several reasons for a large share of policies being outside the SFHA. One could be adverse selection: These could be areas where there is substantial flood risk outside the SFHA; homeowners are aware of this and so choose to insure. Stormwater flooding, for example, is not included in most FEMA maps and is a growing concern for some communities. Recent experience could indicate to residents that even if not shown as being high risk on a FEMA map, they are indeed at risk. The lower cost PRP policies could also make it more affordable to secure insurance coverage for these homes.
Another driver could be more effective local efforts to help residents understand their flood risk and encourage them to buy flood insurance voluntarily. Some municipalities with substantial numbers of their policies out of the SFHA participate in the NFIP’s Community Ratings System (CRS), where communities can earn premium discounts by implementing flood plain management activities that exceed NFIP requirements. One of the primary categories of CRS activities is public information provision. This involves advising people about the flood hazard, encouraging the purchase of flood insurance, and providing information about ways to reduce flood damage.
For example, the City of Sacramento currently has 32 public outreach projects that provide flood hazard information and/or promote flood insurance in the community. Projects include high water marks, a Flood Ready webpage, an annual Flood Preparedness Week, flood education programs for elementary school students, and sending flyers, newsletters, and brochures.
Closing the Gap
There is still a large flood insurance gap in the United States. This gap, however, is not uniform around the country. Some coastal areas have gone much further in closing the gap than other flood-prone communities. The communities that have many policies outside the SFHA, while likely having unmapped flood risk, can also highlight approaches to encouraging voluntary purchase of flood insurance. Further research is needed to better understand the key drivers of voluntary purchase so that policymakers, flood-plain managers, and other stakeholders can develop well-informed strategies for closing the flood insurance gap within and beyond the SFHA and in all parts of the country.
*FEMA differentiates between contracts in force and policies in force for multi-unit structures. An insured structure counts as one contract in force, but if that structure has multiple units that are covered under one contract, each unit is counted as a policy. So, for example, a 50-unit condominium building is one contract but 50 policies.
Authors

Carolyn Kousky
Director of Policy Research and Engagement, Wharton Risk Center

Brett Lingle
Senior Research Coordinator, Wharton Risk Management and Decision Processes Center